
What is the second marriage divorce rate?
The second marriage divorce rate is meant to be the share of remarriages that end in divorce, and there is no agreed value for it: the confident-sounding percentage most pages quote almost never arrives with a source attached. Trace one back and it usually leads to another article, which leads to a third, which leads nowhere.
What survives that trace is a direction rather than a number: across most published work, second marriages end in divorce somewhat more often than first ones, and later marriages more often again. That direction is worth knowing. The decimal place is not.
This page holds a rule that costs it traffic. A figure appears here only with the name of the body that produced it in the same sentence. Exactly one set of numbers clears that bar, and it does not say what the folklore says it says — which is the subject of the next section.
Where does the “60% of second marriages end in divorce” figure come from?
From a real report that says something else. Trace the familiar percentages — usually 60% or 67% for second marriages, 73% for third — and they converge on Bramlett and Mosher’s 2002 report for the National Center for Health Statistics, Cohabitation, Marriage, Divorce, and Remarriage in the United States. Read the report and none of those numbers is in it. There is no 60%, no 67%, and no estimate for third marriages at all.
What the National Center for Health Statistics actually published are life-table probabilities that a second marriage had disrupted within a fixed number of years, among women aged 15 to 44 interviewed in 1995. On that measure, 15% of remarriages had disrupted within 3 years, and almost a quarter had disrupted within 5 years. “Disrupted” is the report’s own word and it includes separation as well as divorce.
The distance between that and the folklore is four separate errors stacked on one number.
| What the report says | What the folklore says | What was lost |
|---|---|---|
| Probability of breaking up within 3, 5 or 10 years | Share that end in divorce, ever | A fixed horizon became a whole lifetime |
| Disruption — separation or divorce | Divorce | Couples who parted without a decree were quietly reclassified |
| Women aged 15 to 44, interviewed in 1995 | Everybody, now | Men, later remarriers and three decades all disappeared |
| No estimate for third marriages | "73% of third marriages" | A figure invented outright |
This is why the report appears here as a correction rather than as support. It is a good study that answers a narrower question than the one it gets quoted for, and it is old: 1995 data describes nobody’s remarriage today. It cannot be repaired into a second marriage divorce rate, and this page does not try.
Why does every page give a different number?
Because the studies are not measuring the same thing. Four choices sit behind every published figure, and each one moves the result before anyone has looked at a marriage.
| The choice | What it changes | Why the figures move |
|---|---|---|
| Which country | The whole population being counted | Divorce law, waiting periods and how marriages are registered differ, so national figures are not comparable to each other. |
| Which years | The cohort of marriages under study | A figure describing marriages formed decades ago is often quoted as if it described marriages formed now. |
| What counts as an ending | Separation, filing, or final decree | Couples who separate and never file are counted in some studies and not in others. |
| Who is included | Whether widowed and divorced remarriers are pooled | Remarriage after a death and remarriage after a divorce behave differently and are often merged into one line. |
A cohort is the set of marriages formed in a particular span of years, and a figure describing one cohort is routinely reprinted as though it described another.
Consider two studies of the same country that differ only in whether a couple who separated and never filed counts as an ending: both are defensible, and they will not agree.
Two careful researchers can make different choices in that table, publish different numbers, and both be right. The problem is not dishonest research. It is that the number gets lifted out of the study and reprinted with the choices stripped off.
How long do second marriages last?
Reported durations depend on which date the study treated as the end. Separation refers to the point at which a couple stop living together, and it can sit years away from the day a petition is filed or the day a decree is granted; most datasets can only see one of the three.
A duration quoted without naming which of the three it counted is not information. When a figure claims that second marriages last a specific number of years, the first question is whether the clock stopped when the couple stopped living together or when a court finished its paperwork. For example, a couple who stop sharing a home long before the paperwork is finished appear as a short marriage in one dataset and a long one in another.
The related question of how soon people marry again after a divorce runs into the same problem, which is why the page on average time to remarry treats it the same way this one does.
Which marriage has the highest divorce rate?
Rankings hold up better than percentages. Across most published comparisons, first marriages end least often, second marriages more often, and third and subsequent marriages more often still.
Ranking survives differences in definition because a definition that inflates one group tends to inflate all of them. That is why this page will describe order and refuse magnitude. It is also why an ordering can be sound while every specific figure quoted alongside it is unverified.
What this page won't do
The statistics cluster is where remarriage content is least trustworthy, and the reasons are worth naming.
- Quote a percentage without its source
- If the body that produced a figure cannot be named in the same sentence, the figure does not appear here. That rule removed most of the material this page could otherwise have carried.
- Reprint folklore as data
- The best-known remarriage percentages behave like folklore: repeated everywhere, sourced nowhere, and rounded slightly differently each time. Repetition is not evidence, however old the number is.
- Sell the number as a warning
- A high aggregate rate is often used to make readers anxious enough to buy something. A population figure describes a population, and it cannot be applied to one household.
- Offer a readiness test
- Scored quizzes that promise to tell a couple whether their marriage will hold are entertainment. There is no instrument here that claims to predict a specific outcome.
What do the numbers actually say about one couple?
Nothing directly. An aggregate rate is a description of the behaviour of a large group over a period, and it makes no statement about any household inside it. Two people reading the same figure are not each carrying that probability around with them.
Prediction research does exist, and it is about marriages in general rather than remarriages. Gottman and Levenson’s 1992 study of marital dissolution is the usual reference point for it; it was not carried out on remarrying couples, and nothing in it tells one household what its own odds are.
What the aggregates do offer is a list of things that are structurally different in a remarriage, such as money that was already committed elsewhere, children who did not choose the arrangement, housing decided before the relationship began, and a former spouse who remains part of the logistics regardless of anyone’s preference.
That list is more useful than a percentage because every item on it is something a couple can sit down and talk about. The list is essentially the rest of this site: what makes a successful second marriage according to the couples who describe theirs that way, and the practical questions collected across the deciding hub.
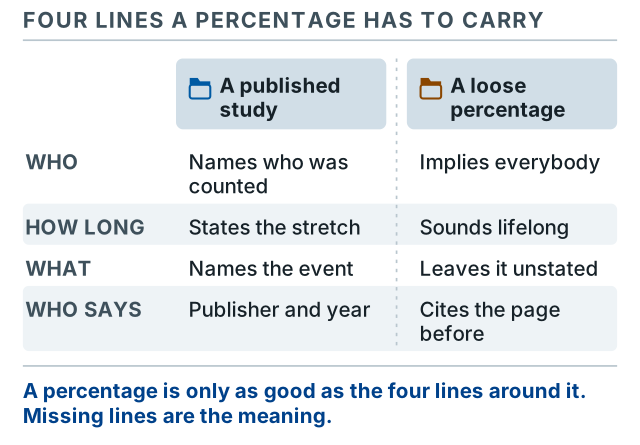
What should be asked of any remarriage statistic?
Before a figure is worth carrying into a decision, a handful of things about it need to be knowable. None of them requires statistical training, and most quoted numbers fail at least one.
Where this page stops
This page can explain why the figures disagree. It cannot say anything about a particular relationship, and it does not try to.
If the question underneath the search is whether a specific marriage should go ahead, that is work for a couples counsellor or a family therapist, ideally one who works with remarriage and stepfamilies. Where money, property or children are the sticking point, a family lawyer answers the legal half and a mediator the rest.
If a reader is in immediate danger, or if fear rather than uncertainty is what brought them to a page about divorce rates, that is a matter for a helpline in their country or for emergency services — not for a statistics page.
The short version
The second marriage divorce rate is quoted with more confidence than the evidence supports. Direction is reasonably clear and magnitude is not, because country, cohort, definition and population all move the result before any marriage is counted.
A reader who leaves with the questions above, and without a percentage, is better equipped than one who leaves with a number and no idea where it came from. Anyone weighing a specific decision, including the unusual case of a couple considering remarrying the same person, will get further from the conversation than from the arithmetic.